Service graphs
|
|
|
|
Graph Information
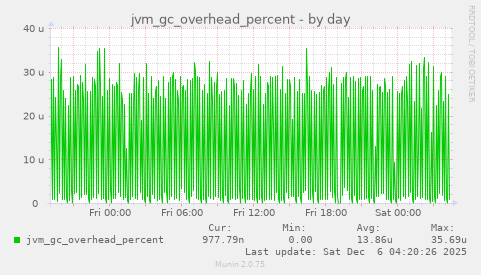
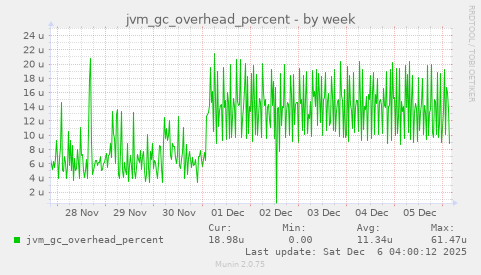
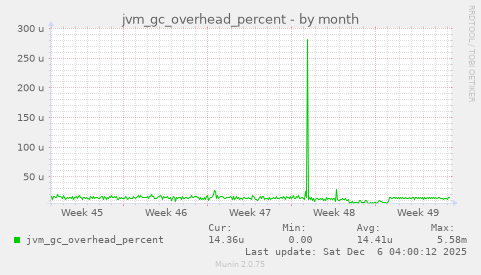
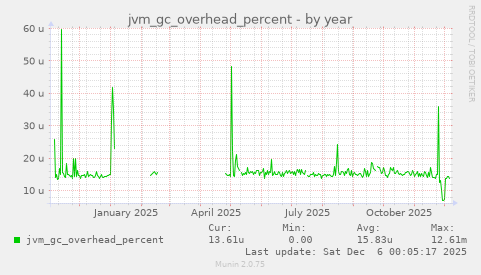
An approximation of the percent of CPU time used by GC activities over the last lookback period or since monitoring began, whichever is shorter, in the range [0..1]
| Field | Internal name | Type | Warn | Crit | Info |
|---|---|---|---|---|---|
| jvm_gc_overhead_percent | jvm_gc_overhead_percent | gauge |